Educacion gratuita
Entendiendo el Higado Graso
Una guía educativa detallada sobre la fisiología del hígado, sus fases, valores de laboratorio y lo que dice la investigación publicada.
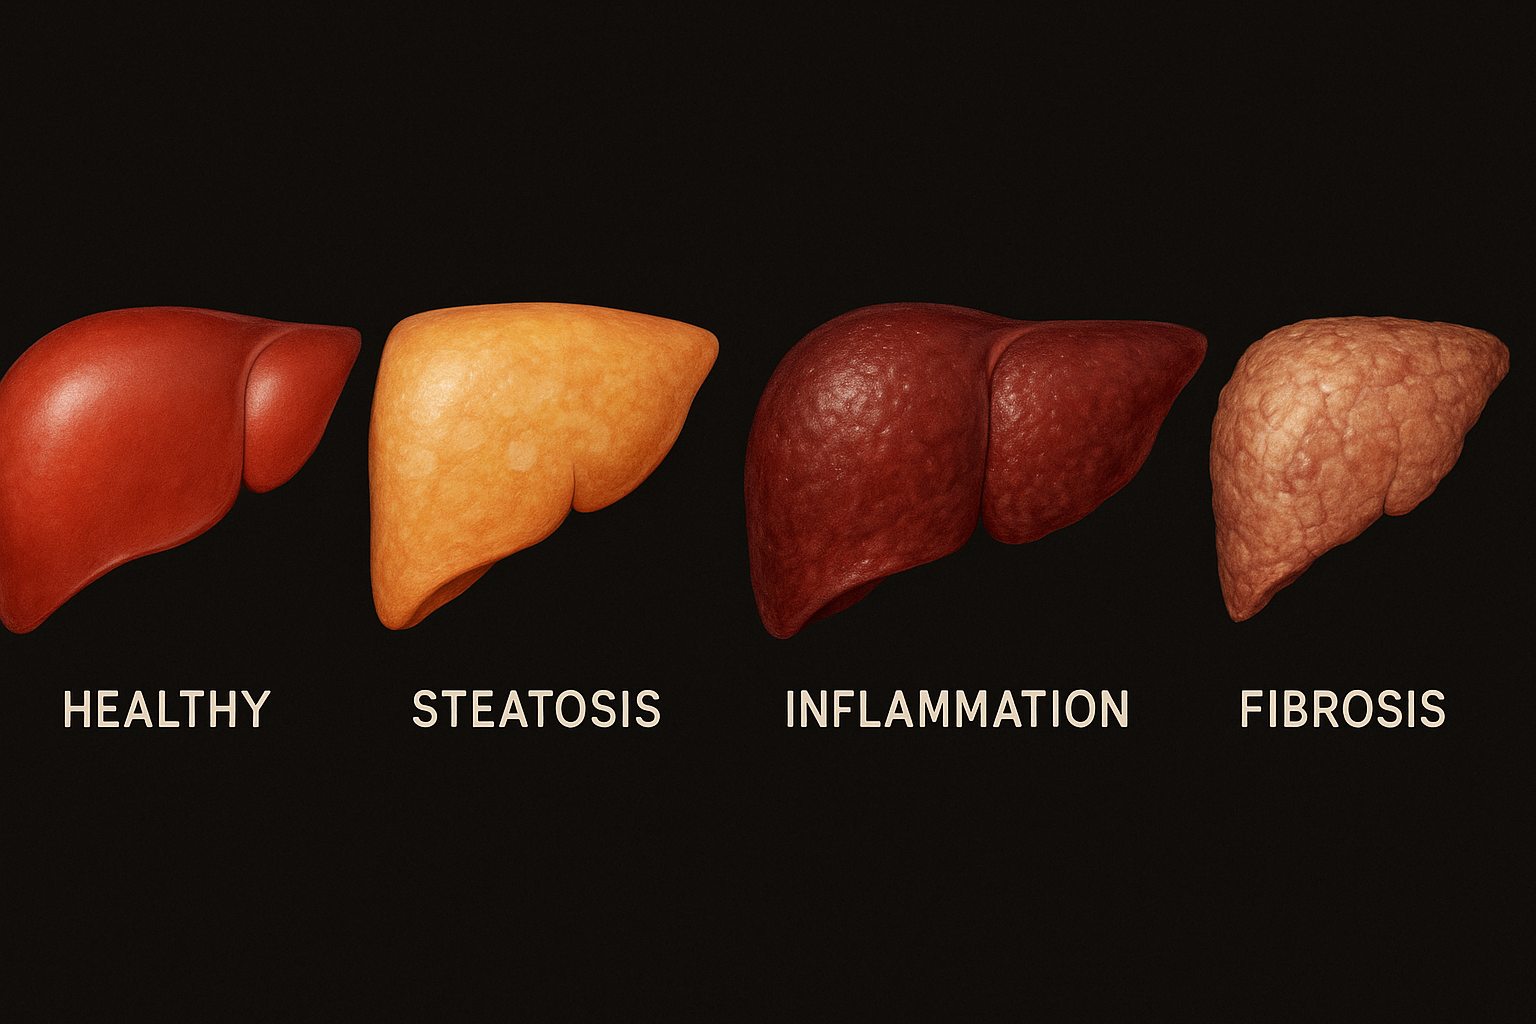
Las 5 Etapas de la Enfermedad Hepatica
Higado Sano
Higado normal con menos de 5% de contenido graso. Realiza todas las 500+ funciones de manera optima. Todos los valores de laboratorio dentro de rangos normales. Ecografia muestra ecogenicidad (patron de brillo) normal.
Esteatosis (Higado Graso)
La grasa se acumula en mas del 5% de las celulas hepaticas. Usualmente asintomatico (sin sintomas). ALT puede estar levemente elevada. Ecografia muestra aumento de ecogenicidad (mas brillante que los rinones). REVERSIBLE con cambios dieteticos.
NASH (Esteatohepatitis)
Esteatohepatitis No Alcoholica — grasa MAS inflamacion y dano celular hepatico (balonamiento de hepatocitos). ALT y AST elevadas. GGT frecuentemente elevada. Fatiga y molestia en cuadrante superior derecho pueden aparecer. Aun potencialmente REVERSIBLE pero requiere cambios significativos de estilo de vida.
Fibrosis
Tejido cicatricial comienza a reemplazar tejido hepatico sano. Graduado F1-F4 en la escala METAVIR. La funcion hepatica comienza a declinar. FibroScan (elastografia transitoria) mide la rigidez del higado en kPa (kilopascales). Fibrosis temprana (F1-F2) aun puede ser parcialmente reversible. Fibrosis avanzada (F3-F4) es mas dificil de revertir.
Cirrosis
Cicatrizacion extensa con perdida de la arquitectura normal del higado. Funcion hepatica severamente comprometida. Riesgo de hipertension portal (presion alta en el sistema de la vena porta), ascitis (liquido en abdomen), sangrado variceal y carcinoma hepatocelular (cancer de higado). Puede requerir trasplante de higado. NO reversible.
Valores de Laboratorio Clave Explicados
| Prueba | Rango Normal | Que Te Dice |
|---|---|---|
| ALT | 7-56 U/L | Marcador de dano celular hepatico. Elevado en higado graso. |
| AST | 10-40 U/L | Dano hepatico y muscular. La relacion AST/ALT ayuda a diferenciar causas. |
| GGT | 9-48 U/L | Obstruccion de vias biliares, consumo de alcohol, indicador de higado graso. |
| Trigliceridos | <150 mg/dL | Niveles de grasa en sangre. Elevados = higado produciendo exceso de grasa. |
| Glucosa en Ayunas | 70-100 mg/dL | Niveles de azucar. 100-125 = pre-diabetes. >126 = diabetes. |
| HbA1c | <5.7% | Promedio de azucar de 3 meses. 5.7-6.4% = pre-diabetes. >6.5% = diabetes. |
Imagenologia: Lo Que Muestra la Ecografia
La ecografia es el estudio de imagen de primera linea para el higado graso. El radiologo compara la ecogenicidad (brillo) del higado con el rinon derecho:
- ● Normal: higado y rinon tienen brillo similar
- ● Grado 1: higado ligeramente mas brillante que rinon
- ● Grado 2: higado mucho mas brillante, vasos sanguineos empezando a verse difusos
- ● Grado 3: higado muy brillante, vasos sanguineos y diafragma oscurecidos
Referencias Seleccionadas
Younossi ZM, et al. "Global epidemiology of nonalcoholic fatty liver disease." Hepatology, 2023. DOI: 10.1002/hep.32660
Rinella ME, et al. "A multisociety Delphi consensus statement on new fatty liver disease nomenclature." Hepatology, 2023. DOI: 10.1097/HEP.0000000000000520
Lustig RH. "Fructose: It's alcohol without the buzz." Advances in Nutrition, 2013. DOI: 10.3945/an.112.002998
Stefan N, et al. "A global view of the interplay between non-alcoholic fatty liver disease and diabetes." Lancet Diabetes Endocrinol, 2022. DOI: 10.1016/S2213-8587(22)00003-1
Quieres el Protocolo Completo de Recuperacion?
Guia semana a semana, recetas pro-hepaticas y educacion IA 24/7 disponibles con una suscripcion.
Precios